

What is Looker?
Looker is a business intelligence software company that helps turn data into insights. Its software is used by data analysts, business analysts, and marketing professionals to explore data, create reports and dashboards, and collaborate with colleagues. Looker was founded in 2012 and is headquartered in Santa Cruz, California.
Looker is a business intelligence software that helps organizations make data-driven decisions. The software provides users with the ability to create custom reports and dashboards to visualize data. Looker also offers a variety of features that allow users to drill down into data, perform analysis, and collaborate with others.
Looker is a data platform that provides business intelligence (BI) for companies of all sizes. It offers users the ability to create and explore data, as well as share insights with others. Looker is a cloud-based platform, so it can be accessed from anywhere with an internet connection.
Looker provides users with the ability to answer complex questions about their data in seconds. The platform also makes it easy to share insights with colleagues, clients, and partners. Looker is constantly adding new features and functionality to help users get the most out of their data.
Looker offers a variety of features that make it easy for businesses to find and analyze the data they need. These features include a user-friendly interface, support for multiple data sources, and the ability to create custom reports and dashboards.
You will benefit greatly from our Looker Training if you have an interest in Looker.
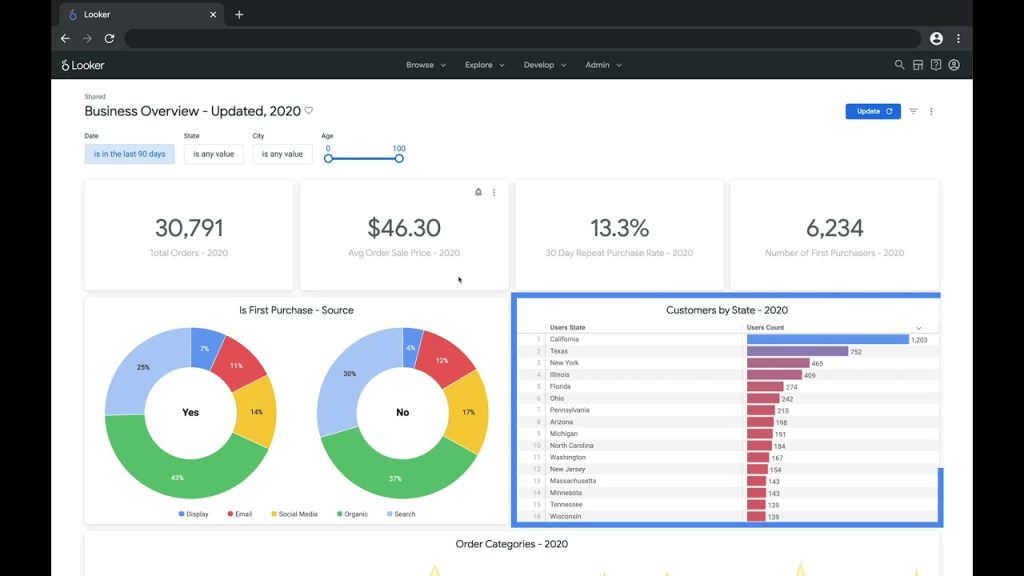
What is a dashboard?
A dashboard is a user interface that allows users to easily see and interact with data. Dashboards typically display data in the form of charts and graphs, and often allow users to filter and manipulate data to better understand it. Dashboards are a popular way to visualize data because they can provide a lot of information at a glance, and make it easy to identify trends and patterns.
A dashboard is a user interface that provides at-a-glance views of key performance indicators (KPIs) relevant to a particular objective or business process. Dashboards typically include one or more metrics, charts, tables, gauges, or other visual elements that communicate key information at a glance.
The term “dashboard” originates from the automobile world, where it refers to the cluster of gauges and warning lights that provide critical information to the driver. In the business world, the term has come to refer to any type of interactive data visualization tool that gives users quick and easy access to information relevant to their specific needs.
There is no one-size-fits-all definition of what should go on a dashboard; it depends entirely on the KPIs that are most important to the organization..
How to create a dashboard in Looker
A dashboard is a powerful way to visualize data and get insights from your Looker analytics. You can use a dashboard to track KPIs, compare data sets, and drill down into the details of your data.
Creating a dashboard in Looker is easy with the help of the Dashboard Builder. The Dashboard Builder is a drag-and-drop interface that makes it simple to add charts and tables to your dashboard.
To create a dashboard in Looker:
- Start by creating a new project in Looker. Give your project a name and description, then click “Create Project.”
- Next, you’ll need to add some data to your project. Click “Add Data” and select the data source you want to use.
- Once you’ve added your data, it’s time to start creating visualizations. Click “Create Visualization” and choose the type of visualization you want to create.
- After you’ve created some visualizations, you can add them to your dashboard.
How to add data to a dashboard in Looker
Adding data to a dashboard in Looker is simple and easy to do. Here are the steps:
- Log in to your Looker account and click on the Dashboards tab.
- Click on the New Dashboard button.
- Enter a name for your new dashboard and click on the Create Dashboard button.
- Click on the Add Data button.
- Select the data you want to add to your dashboard from the list of available data sets.
- Click on the Add to Dashboard button.
- Your new data will appear on your dashboard!
How to share a dashboard in Looker
In Looker, you can share a dashboard with other users in your organization. To do this, click on the “Share” button in the upper right corner of the dashboard. In the Share Dashboard dialog, you can add users and groups who should have access to the dashboard. You can also specify whether they should have view-only or edit access.
Assuming you have a dashboard you want to share in Looker:
- Select the Share button in the upper right corner of the dashboard.
- In the pop-up modal, choose whether you want to share the dashboard via email or a link.
- If sharing via email, enter the email addresses of the recipients, a subject, and a message. Then click Send Email.
- If sharing via link, copy the generated link and share it with your intended audience however you’d like.
- Recipients who click on the shared link will be taken to your Looker instance and prompted to log in if they are not already authenticated.
- After logging in, they will be brought directly to the shared dashboard.
Conclusion
In conclusion,Looker is a powerful tool that allows users to create custom dashboards to visualize their data. Dashboards can be created from scratch or by using Looker’s pre-built templates. To create a dashboard, users first need to select the data source, then choose the visualization type and layout. Once the dashboard is created, it can be shared with others or embedded on a website.